


In this digital economy, it’s not enough to simply deliver a custom web and mobile strategy that meets a client’s functional specifications. For our clients focused on incorporating DevOps into their ecosystem and culture, our deliverables need to support their goals of maximizing mean time between failures (MTBF) and minimizing mean time to resolution (MTTR).
Less unplanned work responding to outages and regressions means more time developing features and building products, perfect for Agile development methodologies. If you’re going to support fixing breakages faster and even preventatively, you need to be able to see how your applications, services, and systems are performing. For that, we recommend statsd.
If you’re unfamiliar with statsd, it is a node.js based measurement server open-sourced by Etsy. They blogged about it when they released it.
The quick and dirty is that statsd metrics aggregate counters (how many times something happened), gauges (how many of a thing there are), and timers (how long something took) – all organized by keys. Keys are dot-separated hierarchical (e.g. “myapp.staging.www-01.users.login.failed_captcha”) It then flushes them to Graphite in five minute intervals. Graphite is a Python web application that uses the vector graphics library libcairo to render graphs of raw or aggregated data and uses an RRD-like database called whisper to store its datapoints. Statsd Graphite can also return datasets as raw JSON.
More or less, that’s it. It sounds simple, but what does this get us?
-
- Measure everything. Anything. All the time. Cheaply. By environment. By host. Measure how long a particular subroutine takes. Measure how many times a particular subroutine runs. Measure how long an individual database query takes. Measure how many comments are in the system. Measure how many 500’s the Facebook Graph API is throwing you. Measure how many API calls to the Twitter API you have remaining. Measure how many lines of code change per day on Github.
-
- Add new metrics with single lines of code, context-managers, or decorators.
-
- Make whatever graphs you want. Over whatever time period you want. With whatever metrics you want. With as many metrics as you want. With whatever aggregation functions you want. And bookmark a URL to see that graph again any time you want. Or build your own dashboard of graphs. Or add them to Confluence pages.
-
- Measure whatever you want without having to ask anybody, tell anybody. Visualize and explore your metrics without getting in anybody else’s way trying to explore the same data.
But…New Relic. I’m not suggesting you stop having New Relic. The day the heavens opened and New Relic descended, the people rejoiced, and rightly so. New Relic provides accessible, preconfigured dashboards that give high level operational intelligence. How is statsd different-than/complementary-to New Relic?
-
- More granular metrics with lower barrier to entry: You don’t have to write a plugin. You write one line of code or decorate a function. That’s it.
-
- More application-specific data exploration: Using the graphite dashboard, you can explore the metrics and datasets in any way you want. And you can embed those graphs into any other web page you want. And you can aggregate and compare any metrics you want within the same graph.
-
- Environment-level granularity: Track improvements to your application in staging or QA before it hits production.
-
- It’s free: both as in speech and as in beer.
It plugs into our favorite web framework, Django, with little effort.
1. pip install django-statsd-mozilla statsd
2. Add to your settings.py:
-
- STATSD_PREFIX = ‘appname.env’
- STATSD_HOST = ‘your-statsd-host.example.com’
- STATSD_CLIENT = ‘django_statsd.clients.normal’
3. Add metrics to your code, like…
-
- statsd.incr(‘api.photo.resized’) # we resized a photo so count it
- statsd.gauge(‘view.expensive_query.dbrowsreturned’, queryset_length) # track how many rows were returned
- @statsd.timer(‘api.serializer.encode_time’) # track how long it takes us to encode a photo set to JSON
- with statsd.timer(‘redis.newsfeed.generate ‘): obj.do_stuff() # as a context manager
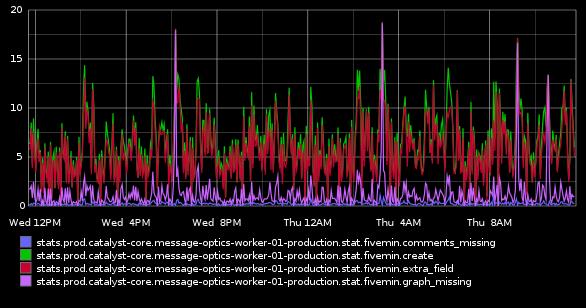
That’s it. You’re done. Metrics just start showing up in graphite. Graphite comes with a web based explorer and graph builder so you can design your own visualizations and bookmark the URLs to generate them.
From an ops perspective, statsd and graphite would require deploying a server with the node.js statsd server, the graphite library, and the web interface to graphite via an HTTP WSGI container. It could remain behind the firewall, and any server that could talk to it on UDP/8125 can record metrics. If the statsd server is unavailable, the code keeps on humming – no breakages introduced, as UDP is fire-and-forget. For a developer’s environment, django_statsd can improve testing and visibility, as it can record its metrics to things other than a statsd server, like to log, to nose, or to the django-debug-toolbar.
And if your ops people need an added bonus, encourage them to look at Diamond, a Python daemon released by BrightCove that reports system and hardware performance metrics into statsd. Build your own graph collection of KPI metrics and set it up as a live dashboard in your operations center.
With statsd Python, you can collect metrics on anything you can imagine cheaply and effortlessly. With Graphite, you can visualize and explore your application’s performance in ways customized specifically for you. When you know what your application is doing, it becomes infinitely easier to respond to operational outages.